Section: Research Program
A Geometric View of Diversity
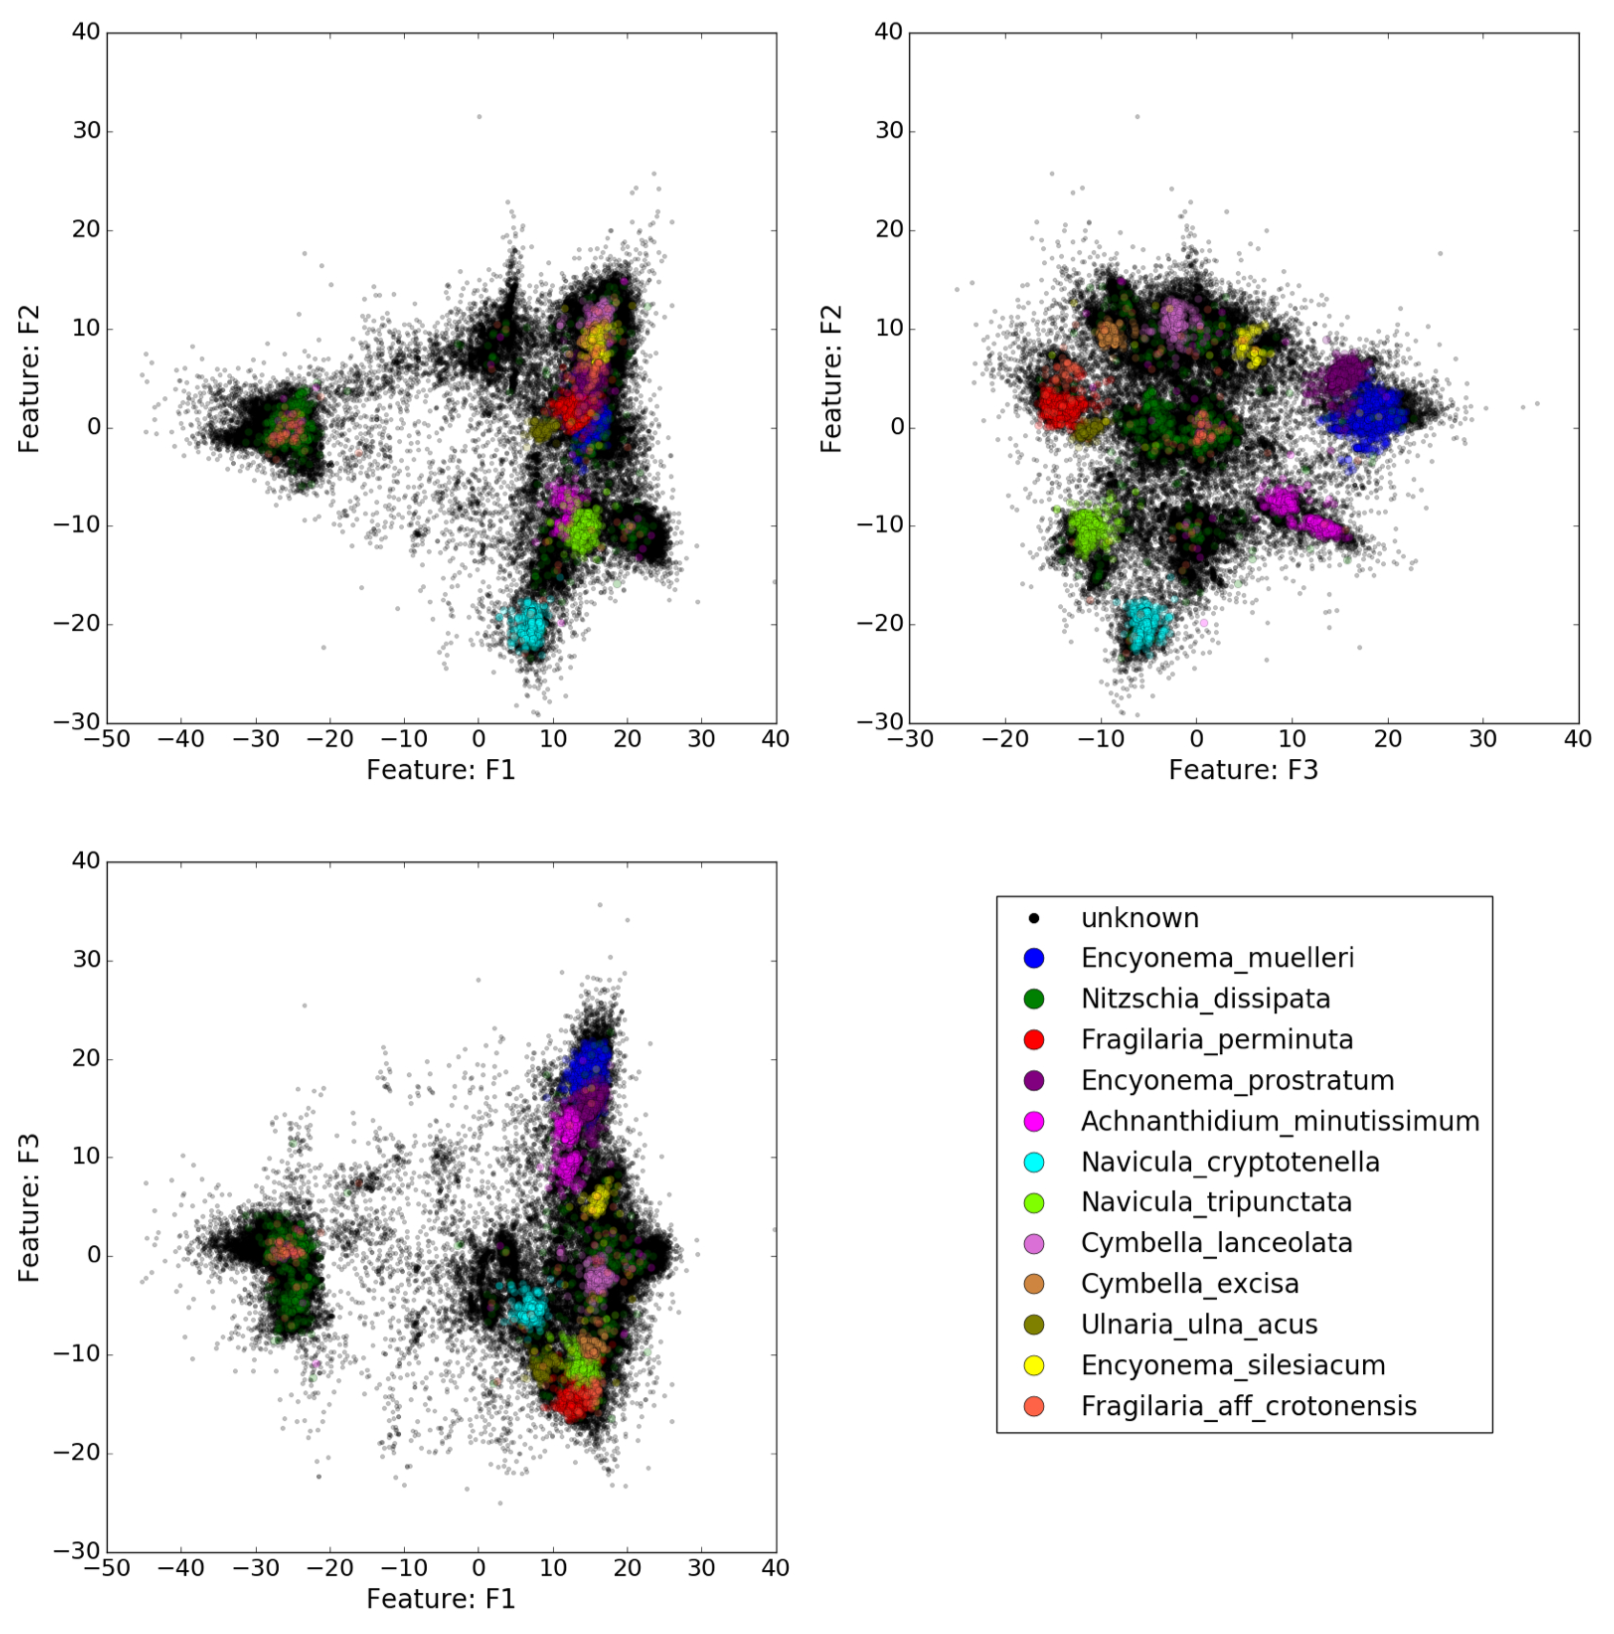
Diversity may be studied as a set of dissimilarities between objects. The underlying mathematical construction is the notion of distance. Knowing a set of objects, it is possible, after computation of pairwise distances, or sometimes dissimilarities, to build a Euclidean image of it as a point cloud in a space of relevant dimension. Then, diversity can be associated with the shape of the point cloud. The human eye is often far better than an algorithm at recognizing a pattern or shape. One objective of our project is to narrow the gap between the story that a human eye can tell, and that an algorithm can tell. Several directions will be explored. First, this requires mastering classical tools in dimension reduction, mainly algebraic tools (PCA, NGS, Isomap, eigenmaps, etc ...). Second, neighborhoods in point clouds naturally lead to graphs describing the neighborhood networks. There is a natural link between modular structures in distance arrays and communities on graphs. Third, points (representing, say, DNA sequences) are samples of diversity. Dimension reduction may show that they live on a given manifold. This leads to geometry (differential or Riemannian geometry). It is expected that some properties of the manifold can tell something of the constraints on the space where measured individuals live. The connection between Riemannian geometry and graphs, where weighted graphs are seen as mesh embedded in a manifold, is currently an active field of research [28], [27]. See as well [30] for a link between geometric structure, linear and nonlinear dimensionality reduction.
|
Biodiversity and high-performance computing: Most methods and tools for characterizing diversity have been designed for datasets that can be analyzed on a laptop, but NGS datasets produced for metabarcoding are far too large. Data analysis algorithms and tools must be revisited and scaled up. We will mobilize both distributed algorithms like the Arnoldi method and new algorithms, like random projection or column selection methods, to build point clouds in Euclidean spaces from massive data sets, and thus to overcome the cubic complexity of computation of eigenvectors and eigenvalues of very large dense matrices. We will also link distance geometry [22] with convex optimization procedures through matrix completion [15], [17].
Intercalibration: There is a considerable difference between supervised and unsupervised clustering: in supervised clustering, the result for an item


