Section: New Results
SAR imagery for remote sensing
Stochastic modeling for very high resolution SAR image processing
Participants : Aurélie Voisin, Vladimir Krylov, Josiane Zerubia [contact] .
This work is done in collaboration with DIBE, University of Genoa, with Dr Gabriele Moser and Prof. Sebastiano B. Serpico [http://spt.dibe.unige.it/ ] with partial financial support of the French Defense Agency, DGA [http://www.defense.gouv.fr/dga/ ]. The data are provided by the Italian Space Agency, ISA [http://www.asi.it/en ].
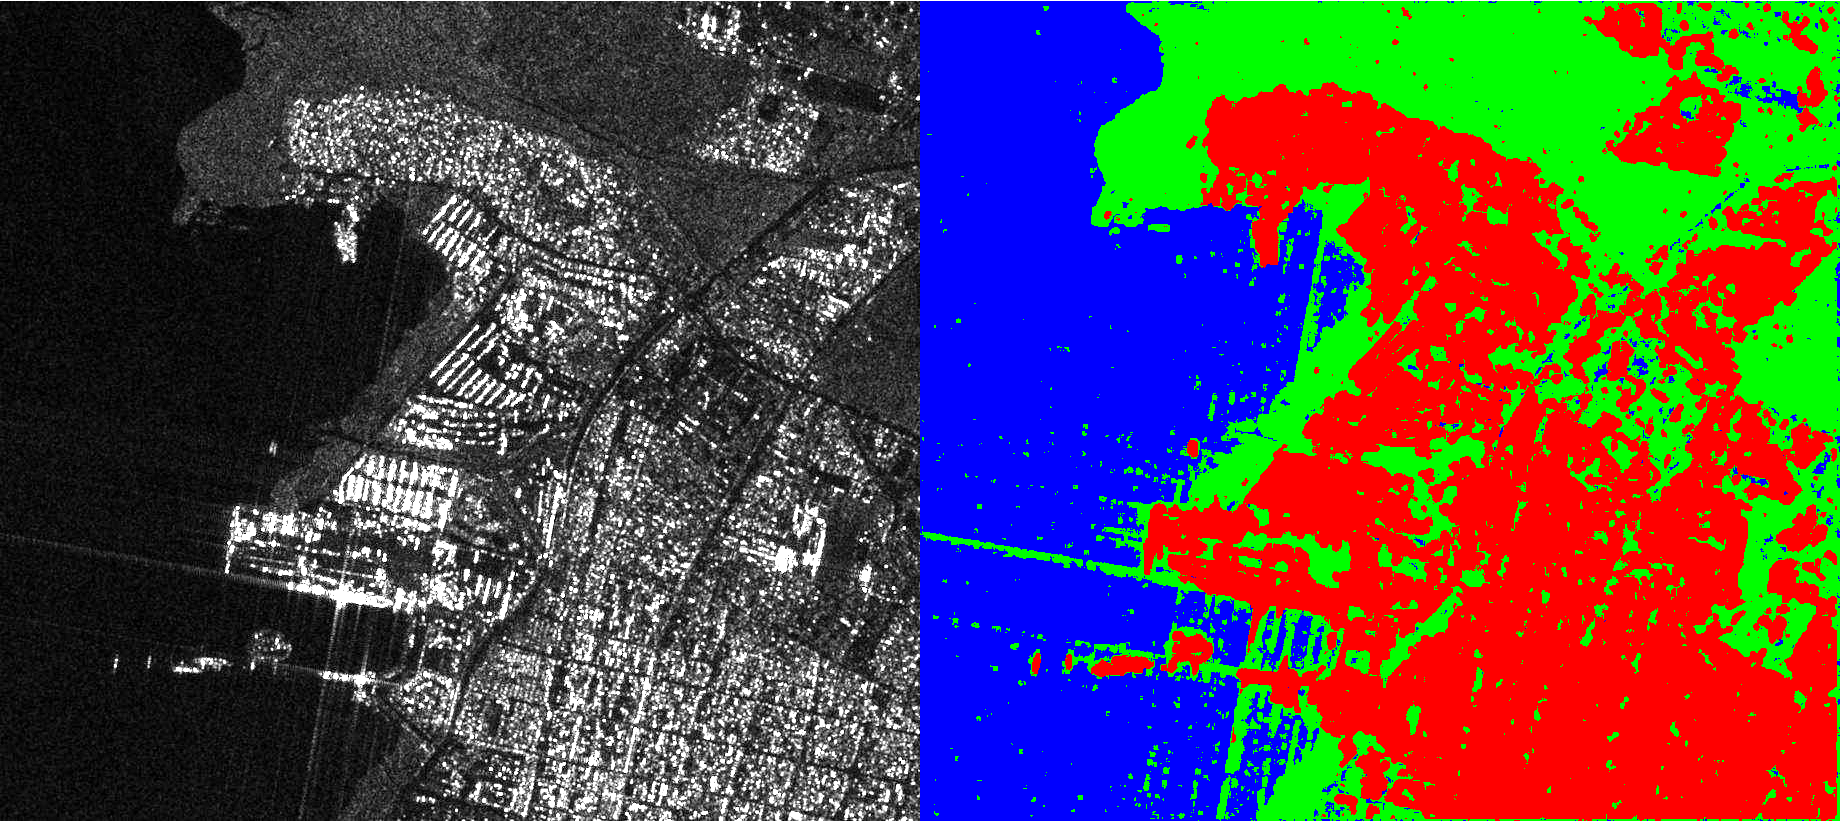
We deal with the environmental risk assessment by addressing the problem of classifying SAR images of urban areas. Several difficulties need to be considered to address the SAR classification problem. The first one is related to the inherent multiplicative noise known as speckle, which degrades appreciably the registered imagery. Another difficulty is the heterogeneity of urban areas on very high resolution (VHR) images that leads to heterogeneous statistical modeling, reflecting the different ground materials such as asphalt, concrete, metal, etc. We propose a hierarchical statistical Bayesian supervised classification approach that consists of two steps. The first step deals with the SAR amplitude statistical modeling for each target class (e.g. vegetation, urban, etc.) by using a finite mixture model, estimated by resorting to a dictionary-based stochastic expectation maximization (DSEM) algorithm. More specifically, the SAR amplitude probability density functions (PDFs) are assumed to be mixtures of PDFs automatically chosen inside a predefined dictionary of SAR-specific distribution families. Such mixtures are intended to take into account the above mentioned VHR SAR statistics heterogeneity. We further consider an additional source of information obtained by extracting a textural feature map from the original SAR image in order to optimize the detection of urban areas. Typically, the textural feature is generated by using a Grey Level Co-occurrence Matrix (GLCM)-based method. The marginal PDFs of the original SAR image and the textural feature are combined via copulas, leading to a joint PDF for each class. On the second step the classification map is generated, using the joint copula-based statistics. To improve the robustness with respect to speckle noise, we consider a contextual model based on Markov random fields (MRFs), and, more specifically, a hierarchical MRF, which offers the possibility to take into account the multi-scale information and to deal with multi-resolution imagery [28] . A variety of algorithms were proposed to estimate the labels on hierarchical graphs. The consideration of a specific graph, here a quad-tree, allows to benefit from its good properties (e.g. causality) and to apply non iterative algorithms. Among the different algorithms employed in the literature, we chose to take into account an exact estimator of the marginal posterior mode (MPM). The cost function associated to this estimator offers the possibility to penalize the errors according to their number and the scale at which they occur: an error at the coarsest scale is stronger penalized than an error at the finest scale. Moreover, we introduce a prior estimation update that experimentally leads to improved results and is less affected by speckle noise when compared to a predefined prior [35] . The challenge of the problem considered here is that our given input is a single-polarized SAR image at a single resolution. To improve the classification, we extract an extra information in the form of a multi-scale wavelet decomposition from the initial image. Then, at each level, the textural feature map is obtained from each image in the decomposition stack. Finally, at each level, the wavelet image is combined with the textural image by using copulas, as described previously in Ariana activity reports. The hierarchical method was tested on real COSMO-SkyMed images. We illustrate the obtained results with an example of a SAR acquisition of the Port-au-Prince quay (Haiti). Spatially disjoint training and test areas were manually annotated. The classification is done following 3 classes: urban areas, natural landscape and wet areas. The results are shown qualitatively in figure 10 . The computation of numerical results gives an average accuracy of percent for the considered test areas.
|
Our previous work was based on single-scale MRF, thus the hierarchical approach is a direct extension. Part of our work was dedicated to the comparison of these two methods [35] , [28] , and we also compared the MRF-based model to a novel products of experts approach [18] .
Parameter estimation procedures for HR SAR image classification
Participants : Vladimir Krylov, Josiane Zerubia [contact] .
This work is conducted in collaboration with DIBE, University of Genoa with Dr. Gabriele Moser and Prof. Sebastiano Serpico [http://spt.dibe.unige.it/ ] with the support of the Italian Space Agency, ASI [http://www.asi.it/en ].
Parameter estimation of probability density functions is one of the major steps in the mainframe of statistical image and signal processing. We have explored the properties and limitations of the recently proposed method of logarithmic cumulants (MoLC) parameter estimation approach which is an alternative to the classical maximum likelihood (ML) and method of moments (MoM) approaches. We have derived the general sufficient condition of strong consistency of MoLC estimates which represents an important asymptotic property of any statistical estimator [33] . We have demonstrated the strong consistency of MoLC estimates for a selection of widely used distribution families originating (but not restricted to) synthetic aperture radar (SAR) image processing. We have then derived the analytical conditions of applicability of MoLC to samples generated from several distribution families in our selection. We have conducted various synthetic and real data experiments to assess the comparative properties, applicability and small sample performance of MoLC notably for the generalized gamma and family of distributions. The synthetic-data experiments have demonstrated a competitive accuracy of MoLC estimates and a reliable behavior of this estimator for small samples which is a critical issue in applications. We have performed real-data image processing experiments to the problem of supervised classification applied to high resolution satellite SAR imagery. These experiments confirmed the stability of MoLC estimator with respect to sample size and at the same time illuminated the critical side of MoLC given by applicability restrictions. The experiments suggested the efficiency of use of the MoLC estimator for finite-mixture estimation problems [3] , [19] , and ML-based classification approaches [4] , [28] , [35] .
|
Unsupervised amplitude and texture based classification of SAR images with multinomial latent model
Participants : Koray Kayabol, Aurélie Voisin, Vladimir Krylov, Josiane Zerubia [contact] .
The participants would like to thank the Italian Space Agency (ASI) for providing the COSMO-SkyMed images. The TerraSAR-X images are provided from http://www.infoterra.de/.
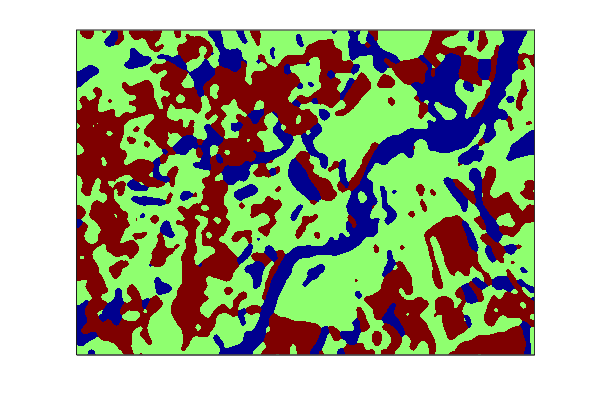
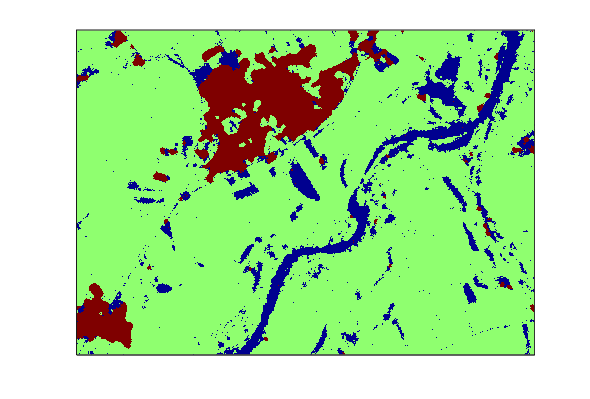
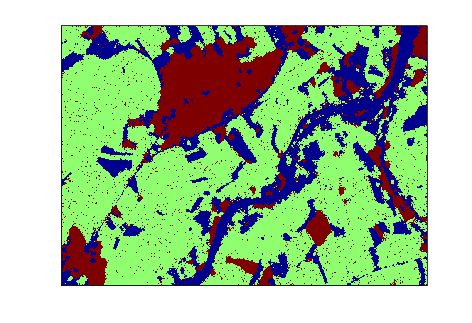
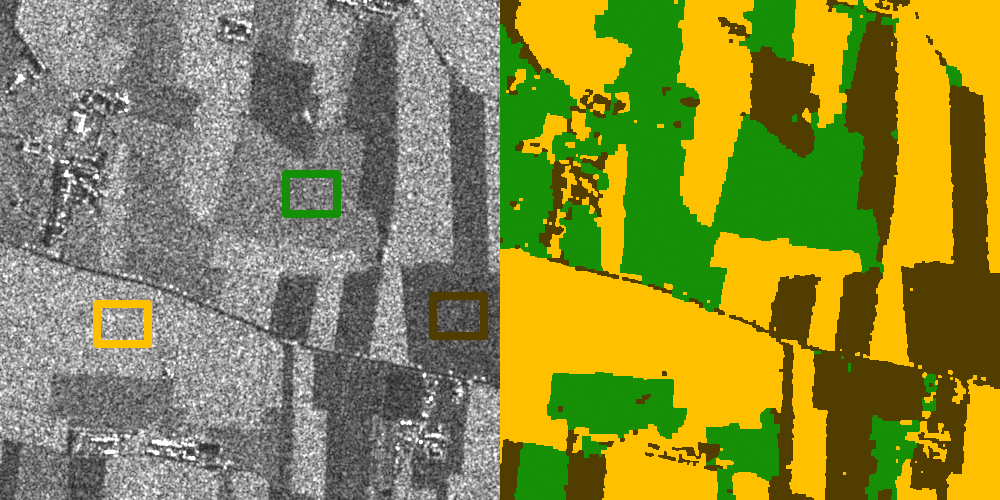
We combine both amplitude and texture statistics of the Synthetic Aperture Radar (SAR) images using Products of Experts (PoE) approach for classification purpose. We use Nakagami density to model the class amplitudes and a non-Gaussian Markov Random Field (MRF) texture model with -distributed regression error to model the textures of the classes. A non-stationary Multinomial Logistic (MnL) latent class label model is used as a mixture density to obtain spatially smooth class segments. The Classification Expectation-Maximization (CEM) algorithm is performed to estimate the class parameters and to classify the pixels [18] . Determining the necessary number of classes to represent the data and initialization are some drawbacks of the EM type algorithms. In [17] and [32] , we combine hierarchical agglomeration, CEM and Integrated Classification Likelihood (ICL) criterion to get rid of the drawbacks of EM. We obtained some classification results of water, land and urban areas in both supervised and unsupervised cases on TerraSAR-X, as well as COSMO-SkyMed data [18] , [17] , [32] . The proposed unsupervised ATML-CEM (Amplitude and Texture density mixtures of MnL with CEM) method provides significantly better results, see Fig. 12 , compared to the corresponding results obtained with K-MnL and its performance is close to supervised ATML-CEM.
| ||||
|